stdClass Object
(
[nazev] => Central Laboratories UCT Prague
[adresa_url] =>
[api_hash] =>
[seo_desc] =>
[jazyk] =>
[jednojazycny] =>
[barva] =>
[indexace] => 1
[obrazek] =>
[ga_force] =>
[cookie_force] =>
[secureredirect] =>
[google_verification] =>
[ga_account] =>
[ga_domain] =>
[ga4_account] => G-VKDBFLKL51
[gtm_id] =>
[gt_code] =>
[kontrola_pred] =>
[omezeni] =>
[pozadi1] =>
[pozadi2] =>
[pozadi3] =>
[pozadi4] =>
[pozadi5] =>
[robots] =>
[htmlheaders] =>
[newurl_domain] => 'clab.vscht.cz'
[newurl_jazyk] => 'en'
[newurl_akce] => '[en]'
[newurl_iduzel] =>
[newurl_path] => 1/20076/20078
[newurl_path_link] => Odkaz na newurlCMS
[iduzel] => 20078
[platne_od] => 26.05.2023 09:28:00
[zmeneno_cas] => 26.05.2023 09:28:48.557372
[zmeneno_uzivatel_jmeno] => Jan Kříž
[canonical_url] =>
[idvazba] => 24782
[cms_time] => 1713511803
[skupina_www] => Array
(
)
[slovnik] => stdClass Object
(
[logo_href] => /
[logo] =>  [logo_mobile_href] => /
[logo_mobile] =>
[google_search] => 001523547858480163194:u-cbn29rzve
[social_fb_odkaz] =>
[social_tw_odkaz] =>
[social_yt_odkaz] =>
[intranet_odkaz] => http://intranet.vscht.cz/
[intranet_text] => Intranet
[mobile_over_nadpis_menu] => Menu
[mobile_over_nadpis_search] => Search
[mobile_over_nadpis_jazyky] => Languages
[mobile_over_nadpis_login] => Login
[menu_home] => Homepage
[paticka_budova_a_nadpis] => BUILDING A
[paticka_budova_a_popis] => Rector,
Department of Communications,
Department of Education,
FCT Dean’s Office,
Centre for Information Services
[paticka_budova_b_nadpis] => BUILDING B
[paticka_budova_b_popis] =>
Department of R&D, Dean’s Offices:
FET,
FFBT,
FCE,
Computer Centre,
Department of International Relations,
Bursar
[paticka_budova_c_nadpis] => BUILDING C
[paticka_budova_c_popis] => Crèche Zkumavka,
General Practitioner,
Department of Economics and Management,
Department of Mathematics
[paticka_budova_1_nadpis] => NATIONAL LIBRARY OF TECHNOLOGY
[paticka_budova_1_popis] =>
[paticka_budova_2_nadpis] => CAFÉ CARBON
[paticka_budova_2_popis] =>
[paticka_adresa] => UCT Prague
[logo_mobile_href] => /
[logo_mobile] =>
[google_search] => 001523547858480163194:u-cbn29rzve
[social_fb_odkaz] =>
[social_tw_odkaz] =>
[social_yt_odkaz] =>
[intranet_odkaz] => http://intranet.vscht.cz/
[intranet_text] => Intranet
[mobile_over_nadpis_menu] => Menu
[mobile_over_nadpis_search] => Search
[mobile_over_nadpis_jazyky] => Languages
[mobile_over_nadpis_login] => Login
[menu_home] => Homepage
[paticka_budova_a_nadpis] => BUILDING A
[paticka_budova_a_popis] => Rector,
Department of Communications,
Department of Education,
FCT Dean’s Office,
Centre for Information Services
[paticka_budova_b_nadpis] => BUILDING B
[paticka_budova_b_popis] =>
Department of R&D, Dean’s Offices:
FET,
FFBT,
FCE,
Computer Centre,
Department of International Relations,
Bursar
[paticka_budova_c_nadpis] => BUILDING C
[paticka_budova_c_popis] => Crèche Zkumavka,
General Practitioner,
Department of Economics and Management,
Department of Mathematics
[paticka_budova_1_nadpis] => NATIONAL LIBRARY OF TECHNOLOGY
[paticka_budova_1_popis] =>
[paticka_budova_2_nadpis] => CAFÉ CARBON
[paticka_budova_2_popis] =>
[paticka_adresa] => UCT Prague
Technická 5
166 28 Prague 6 – Dejvice
IČO: 60461373 / VAT: CZ60461373
Czech Post certified digital mail code: sp4j9ch
Copyright: UCT Prague 2015
Information provided by the Department of International Relations and the Department of R&D. Technical support by the Computing Centre.
[paticka_odkaz_mail] => mailto:Jan.Prchal@vscht.cz
[zobraz_desktop_verzi] => switch to full version
[social_fb_title] =>
[social_tw_title] =>
[social_yt_title] =>
[aktualizovano] => Updated
[autor] => Author
[drobecky] => You are here: UCT Prague – Central Laboratories
[paticka_mapa_odkaz] =>
[zobraz_mobilni_verzi] => switch to mobile version
[nepodporovany_prohlizec] => For full access, please use different browser.
[stahnout] => Download
[preloader] => Wait a second...
[social_in_odkaz] =>
[social_li_odkaz] =>
)
[poduzel] => stdClass Object
(
[20081] => stdClass Object
(
[obsah] =>
[poduzel] => stdClass Object
(
[20093] => stdClass Object
(
[obsah] =>
[iduzel] => 20093
[canonical_url] => //clab.vscht.cz
[skupina_www] => Array
(
)
[url] =>
[sablona] => stdClass Object
(
[class] =>
[html] =>
[css] =>
[js] =>
[autonomni] =>
)
)
[20091] => stdClass Object
(
[obsah] =>
[iduzel] => 20091
[canonical_url] => //clab.vscht.cz
[skupina_www] => Array
(
)
[url] =>
[sablona] => stdClass Object
(
[class] =>
[html] =>
[css] =>
[js] =>
[autonomni] =>
)
)
[20092] => stdClass Object
(
[obsah] =>
[iduzel] => 20092
[canonical_url] => //clab.vscht.cz
[skupina_www] => Array
(
)
[url] =>
[sablona] => stdClass Object
(
[class] =>
[html] =>
[css] =>
[js] =>
[autonomni] =>
)
)
)
[iduzel] => 20081
[canonical_url] =>
[skupina_www] => Array
(
)
[url] =>
[sablona] => stdClass Object
(
[class] =>
[html] =>
[css] =>
[js] =>
[autonomni] =>
)
)
[20082] => stdClass Object
(
[obsah] =>
[poduzel] => stdClass Object
(
[27385] => stdClass Object
(
[nazev] => Laboratory of Atomic Absorption Spectroscopy (AAS)
[seo_title] => Laboratory of Atomic Absorption Spectroscopy (AAS)
[seo_desc] =>
[autor] =>
[autor_email] =>
[obsah] => Analysis
The Atomic Absorption Spectroscopy (AAS) is used in the laboratory to measure the content of metals in inorganic or organic samples. The AAS can be performed with both flame and electrothermal atomization. The samples are measured in the form of solutions in water or organic phase (methanol, ethanol). In some cases, decomposition methods can be employed. The determination of mercury can be performed also in solid samples.
The following elemental analyses are performed in the laboratory (detection limit in mg/l for flame atomization):
|
Ag (0.03)
|
Al (0.4)
|
As (0.6)
|
Au (0.1)
|
|
|
|
B (8)
|
Ba (0.2)
|
Be (0.02)
|
Bi (0.2)
|
|
|
|
Ca (0.01)
|
Cd (0.005)
|
Co (0.05)
|
Cr (0.06)
|
Cs (0.04)
|
Cu (0.04)
|
|
Fe (0.05)
|
Ga (0.7)
|
Ge (1.5)
|
Hg (5)
|
In (0.2)
|
|
|
K (0.01)
|
La (1)
|
Li (0.02)
|
Mg (0.003)
|
Mn (0.02)
|
Mo (0.3)
|
|
Na (0.003)
|
Ni (0.05)
|
Pb (0.1)
|
Pd (0.1)
|
Pt (1.5)
|
|
|
Rb (0.03)
|
Rh (0.15)
|
Sb (0.3)
|
Se (0.5)
|
Si (1.0)
|
|
|
Sn (1)
|
Sr (0.05)
|
Ta (11)
|
Ti (1.5)
|
|
|
|
Tl (0.3)
|
V (0.75)
|
W (6)
|
Zn (0.05)
|
|
|
For some elements, it is possible to achieve lower detection limits by combination of AAS with electrothermal atomization (Hg) or AAS with hydride technique (As, Se, Sb). These methods have to be discussed individually.
Other activities
- consultancy
- research and monitoring in the field of health care and environment
Environmental protection
Analysis of rain water, underground water, and waste water
Air quality, pollution, aerosol particles
Research in the field of population health and environment (government project)
Preparation of tested samples, testing of sample collection machines, research in the field of elemental analysis in aerosol particles (As, Cd, Cr, Mn, Ni, Pb)
[iduzel] => 27385
[canonical_url] => //clab.vscht.cz/aas-en
[skupina_www] => Array
(
)
[url] => /aas-en
[sablona] => stdClass Object
(
[class] => stranka_submenu
[html] =>
[css] =>
[js] =>
[autonomni] => 1
)
)
[27703] => stdClass Object
(
[nazev] => Laboratory of NMR Spectroscopy
[seo_title] => Laboratory of NMR Spectroscopy
[seo_desc] =>
[autor] =>
[autor_email] =>
[obsah] =>
Laboratory of NMR spectroscopy is the part of the Central Laboratories of the University of Chemistry and Technology (ICT) in Prague. The main goal of our laboratory is to measure service NMR samples delivered not only by various school laboratories but also by out-of-school institutions. Apart from basic services we are able to perform more complex non-standard experiments involving their interpretation and evaluation. At the same time our laboratory deals with scientific and teaching activities that involve close cooperation with other departments of ICT.
NMR spectroscopy can be widely used for characterization of organic compounds. In addition to determination of chemical structure of various products and reactions intermediates, NMR is applicable also for mixture component analysis, kinetic and thermodynamic measurements. NMR is also a powerful tool for quantitative and qualitative calculation of geometry of the molecules and their dynamics.
Enormous development of advanced techniques enabled NMR spectroscopy to become the significant method for calculation of the structure of biomacromolecules – proteins and nucleic acids. At present we are solving the spatial geometry of selected proteins of Mason-Pfizer monkey virus.
[iduzel] => 27703
[canonical_url] => //clab.vscht.cz/nmr_en
[skupina_www] => Array
(
)
[url] => /nmr_en
[sablona] => stdClass Object
(
[class] => stranka
[html] =>
[css] =>
[js] =>
[autonomni] => 1
)
)
[27387] => stdClass Object
(
[nazev] => Laboratory of transmission electron microscopy
[seo_title] => Laboratory of transmission electron microscopy
[seo_desc] =>
[autor] =>
[autor_email] =>
[obsah] =>
page under construction
[iduzel] => 27387
[canonical_url] => //clab.vscht.cz/tem-en
[skupina_www] => Array
(
)
[url] => /tem-en
[sablona] => stdClass Object
(
[class] => stranka_submenu
[html] =>
[css] =>
[js] =>
[autonomni] => 1
)
)
[21615] => stdClass Object
(
[nazev] => Central Laboratories
[seo_title] => UCT Prague - Central Laboratories
[seo_desc] =>
[autor] =>
[autor_email] =>
[obsah] =>
The main goal of Central Laboratories at the University of Chemistry and Technology, Prague is to measure service samples delivered by various school laboratories. The analytical services are used for grant and students projects, industrial research application. Analyses are also offered to external customers (universities, private companies etc.). Apart from basic routine analyses more complex non-standard experiments are also performed. The laboratories are equipped with a modern and top-level instrumentation and the the laboratory staff deals with scientific and teaching activities that involve close cooperation with the departments of the University. Central Laboratories consist of nine laboratories, detailed information can be found on their pages.
Richard Hrabal, associate professor
Head of Central Laboratories
| Laboratory of Nuclear Magnetic Resonance (NMR) Spectroscopy |
Head: Richard Hrabal (richard.hrabal@vscht.cz)
Phone: +420 220 443 805
building A, room 42, ground-floor |
| Laboratory of Infra-Red (IR) and Raman Spectroscopy |
Head: Miroslava Novotná (miroslava.novotna@vscht.cz)
Phone: +420 220 444 137
building A, room 310b, 3rd floor |
| Laboratory of Mass Spectrometry (MS) |
Head: Josef Chudoba (josef.chudoba@vscht.cz)
Phone: +420 220 444 3812
building A, room S08, ground-floor |
| Laboratory of X-ray Diffractometry and Spectrometry |
Head: Jaroslav Maixner (jaroslav.maixner@vscht.cz)
Phone: +420 220 444 201 or 5023
GSM: +420 730 809 852
building A, room P03 (4th floor), S38 (ground-floor) |
| Laboratory of Thermal-Gravimetric Analysis (TGA) |
Head: Jakub Havlín (jakub.havlin@vscht.cz)
Phone: +420 220 443 834
building B, room S28a, ground-floor |
| Laboratory of Atomic Absorption Spectroscopy (AAS) |
Atomic Absorption Spectroscopy
Head: Dana Pokorná (dana.pokorna@vscht.cz)
Phone: +420 220 443 813
building A, room 406 |
| Laboratory of Organic Elemental Analysis |
Head: Anna Bradíková (anna.bruthansova@vscht.cz)
Phone: +420 220 443 810
building A, room 275, 2nd floor |
| Laboratory of Surface Analysis |
Head: Petr Sajdl (petr.sajdl@vscht.cz)
Phone: +420 220 443 073
building B, room S12, ground-floor |
| Laboratory of transmission electron microscopy |
|
Head: Alena Michalcová (alena.michalcova@vscht.cz)
Phone: +420 220 444 202
building A, room 49, ground-floor
|
[iduzel] => 21615
[canonical_url] =>
[skupina_www] => Array
(
)
[url] => /home
[sablona] => stdClass Object
(
[class] => stranka
[html] =>
[css] =>
[js] =>
[autonomni] => 1
)
)
[27384] => stdClass Object
(
[nazev] => Laboratory of Thermal-Gravimetric Analysis (TGA)
[seo_title] => Laboratory of Thermal-Gravimetric Analysis (TGA)
[seo_desc] =>
[autor] =>
[autor_email] =>
[obsah] =>
About thermal analysis
The methods of thermal analysis enable us to offer the following types of sample/material testing:
- Processes taking place under the heating stress connected with mass change (drying, dehydration, oxidation, …)
- Heat exchange (melting, crystallization, glass transition,…)
- Influence of conditions (heating rate, temperature range, atmosphere, …) on thermally-stressed materials
- Thermal stability (decomposition, oxidation, …)
- Design and verification of heat treatment procedures for a wide range of materials
Principles
Thermogravimetric analysis (TGA)
A sample is subjected to a controlled heating/cooling program (non-isothermal or isothermal) and its weight is measured over time at a range of temperatures.
Differential thermal analysis (DTA)
The sample is heated/cooled at the chosen temperature rate at the same time as a reference, which will remain constant. The temperature difference caused by changes in the sample is recorded and the type of interaction monitored as it takes place. The dependence of the temperature difference on both temperature and time shows the heat aspect of the interaction taking place during the heating or cooling of the sample (exothermic or endothermic effects).
Differential scanning calorimetry (DSC)
DSC monitors heat effects associated with the phase transitions and chemical reactions as a function of temperature. Through appropriate calibration, the results are converted from microvolts to milliwatts. These results show the effects of the interactions and amount of exchanged energy.
Mass spectrometry (MS) combined with thermal analysis (TA)
The quadrupole mass spectrometry analyser enables the detection of chosen masses up to 300 amu. The masses are related to the gases that evolve during the thermal treatment of the sample.
Fourier transform infrared spectroscopy (FTIR) combined with thermogravimetric analysis (TGA)
The infrared spectrometer enables the analysis of the gases that evolve from the thermal analyser during sample analysis.
[iduzel] => 27384
[canonical_url] => //clab.vscht.cz/tga-en
[skupina_www] => Array
(
)
[url] => /tga-en
[sablona] => stdClass Object
(
[class] => stranka_submenu
[html] =>
[css] =>
[js] =>
[autonomni] => 1
)
)
[27383] => stdClass Object
(
[nazev] => Laboratory of X-ray Diffractometry and Spectrometry
[seo_title] => Laboratory of X-ray Diffractometry and Spectrometry
[seo_desc] =>
[autor] =>
[autor_email] =>
[obsah] =>
Laboratory of X-ray diffractometry and spectrometry is part of the Central Laboratories at the University of Chemical Technology in Prague. Its main mission is the determination of phase composition using X-ray diffraction analysis(XRD) involving the measurement and evaluation of diffraction patterns and elemental composition by X-ray fluorescence analysis (XRF) of samples supplied from university departments but also from outside the university. In addition to the basic service, specialized or complex experiments, including evaluation can be performed.
X-ray powder diffraction analysis (XRPD, mineralogical analysis, phase analysis) could be used to measure solid samples in the form of powders or flat compacts to determine amorphous or crystalline state of samples. The determination of crystalline phases is performed on the base of comparison measured d, I values with d,I values in databases PDF-4+(Powder diffraction file, inorganic measured and calculated data) or PDF-4/Organics (organic calculated data). Database PDF-4+ includes cards (reference 04-) with x,y,z coordinates of atoms, which could be used for quantitative Rietveld`s analysis.
XRD analysis is mainly used to characterise solid samples, inorganic and organic. Laboratory deals with all chemical problems having relation to solid phase, solid state reactions and heterogeneous systems. It can provide information about progress of solid state reaction, about qualitative and quantitative phase composition of solids, crystalline polymorphism, crystallite size (1-500nm), degree of crystallinity, structural perfection, texture. Special area is molecular and crystal structure of organic or inorganic compounds from single crystals, high-temperature measurement of powders in the range 20-1400°C.
XRD became an indispensable method for studies of corrosion processes, catalytic reactions, synthesis of ceramic materials and pharmaceutic substances(API), research of semiconductors. XRD is not a trace analysis, 0.1 hm.%. is the Limit of Detection(LOD). Recommended quantity of sample for XRD is in section Service. XRD measurement is non-destructive and sample can be used for another analysis.
MicroXRD deals with spot analysis in range 0.1-2 mm. The main advantage is possibility to analyse no-plane compacts in different shapes (e.g. pipes, wires).
X-Ray fluorescent analysis is used to determine elements in range Be-U in powders or compact samples. It is possible to measure liquids as well with restriction to range F-U and worse detection limits for F-Si. Liquids are measured in cups, bottom of the cup is foil, usually 6 micrometer mylar or 4 micrometer polypropylene. Measured liquid must not react with foil, preferably having pH in range 5-7(F-Mg are measured with WD spectrometers). Thera are almost no restriction on pH and reactivity of liquid when ED spectrometer is used, but only Al-U elements can be measured. XRF is suitable for determination of more elements simultaneously (standard F-U), limit of detection generally improves with growing atomic (proton) number, advantage is low overlap among elements, light elements Be-Si should be measured on samples with smooth surface. This is really necessary for Be-O. Recommended quantity of sample for XRD is in section Service. The measurement is mostly non-destructive (warning-glass may darkened). The element composition of glass, cements, ashes, clays, alloys is the main application.
X-ray single crystals diffraction is used for determination of molecular and crystal structure of organic or inorganic moleculs(up to 100 nonH atoms in asymmetric part of cell). Single crystal with size in range 100-1000microns is necessary. Growing of single crystals from solutions can be performed in laboratory, at least 50mg of sample and knowledge about solubility in different solvents is necessary.
[urlnadstranka] =>
[iduzel] => 27383
[canonical_url] =>
[skupina_www] => Array
(
)
[url] => /rtg-en
[sablona] => stdClass Object
(
[class] => stranka_submenu
[html] =>
[css] =>
[js] =>
[autonomni] => 1
)
)
[27382] => stdClass Object
(
[nazev] => Laboratory of Infra-Red (IR) and Raman Spectroscopy
[seo_title] => Laboratory of Infra-Red (IR) and Raman Spectroscopy
[seo_desc] =>
[autor] =>
[autor_email] =>
[obsah] =>
Laboratory of Molecular Spectroscopy is the part of the Central Laboratories of the University of Chemistry and Technology (UCT) in Prague. We are mainly focused on analysis of unknown substances, identifying their functional groups, verifying the purity of substances and determination of mixtures composition using Infrared (FT-IR) and Raman spectroscopy.
Infrared and Raman Spectrometry can be used in many fields, such as structural analysis of organic and inorganic materials, analysis of foreign substances in the environment, analysis of combustion gases, polymers, sorbents, fillers and adhesives of paper and resins, adhesives for denture, analysis of dyes, fillers and emails used in art and historical works.
Infrared Spectrometry is also used in food analysis (determination of sugars or ethanol in alcoholic drinks, analysis of wines and honey), in medicine (bladder stones), in ecology (determination of petrochemical substances in air and soil, determination of respirable silica in the air, detection of allergenic pollen) and in industrial analysis (determination of additives in oils).
The scientific activity of the laboratory is focused on the development and improvement of measurement methods and on combining of the results obtained by various measurement techniques, which lead to a more reliable solution of the analytical problem.
[urlnadstranka] =>
[iduzel] => 27382
[canonical_url] =>
[skupina_www] => Array
(
)
[url] => /ir-en
[sablona] => stdClass Object
(
[class] => stranka_submenu
[html] =>
[css] =>
[js] =>
[autonomni] => 1
)
)
[27381] => stdClass Object
(
[nazev] => Laboratory of Surface Analysis
[seo_title] => Laboratory of Surface Analysis
[seo_desc] =>
[autor] =>
[autor_email] =>
[obsah] =>
To measure the surface the laboratory is equipped with ESCAProbeP manufactured by Omicron Nanotechnology Ltd. The device is equipped with a monochromator , the two types of ion guns , electron detection with 5 channeltrony , possibility of compensation charging of the sample using a source of low-energy electrons, the source of UV radiation for analysis of valence states , fokusovatelným electron source and a secondary electron detector .
Most frequent analyses
- Oxidation levels of catalysers
- Surface of organic materials (mainly after some processing) and monitoring of surface changes
- Corrosion
- Layers for chemical sensors
- Materials for electronics with measurement of concentration profiles
[iduzel] => 27381
[canonical_url] => //clab.vscht.cz/lap-en
[skupina_www] => Array
(
)
[url] => /lap-en
[sablona] => stdClass Object
(
[class] => stranka_submenu
[html] =>
[css] =>
[js] =>
[autonomni] => 1
)
)
[25101] => stdClass Object
(
[nazev] => Laboratory of Organic Elemental Analysis
[seo_title] => Laboratory of Organic Elemental Analysis
[seo_desc] =>
[autor] =>
[autor_email] =>
[obsah] =>
The elemental analyses are focused on the determination of following elements – carbon, hydrogen, nitrogen, sulfur, chlorine, bromine, iodine and phosphorus. Analytical methods are based on a sample high-temperature burning in oxygen atmosphere and with a subsequent detection of selected burning products.
Solid or liquid samples can be analysed, e.g. pure chemicals, fuels, coal, heavy oils, plant materials, wood, cellulose etc. Some soils, sands, clays, sediments and other samples being partially or predominantly inorganic can be analyzed. The samples are always destroyed by burning (analyses are destructive).
Analyses
1. Simultaneous determination of carbon, hydrogen, nitrogen and sulfur from one sample
Vario EL Cube analyzer is used for this determination. The analyzer is equipped with a TCD detector and additionally IR detector which is used for determination of the low sulfur content ( below 100 ppm).
Simultaneous C, H, N, S determination is based on high-temperature (up to 1200°C) combustion of the sample in the oxygen stream. Gaseous products of combustion (N2, CO2, H2O a SO2) are purified, separated and finally determined by TCD. Typical samples are organic chemicals but lot of inorganic matters can be analyzed as well.
If your sample contains fluorine in any form and quantity, then the sulfur content cannot be determined. Fluorine containing samples can be analyzed only by the Vario EL III analyzer. In the case of flourinated samples, we can only do the determination of carbon, hydrogen and nitrogen content.
2. Trace and semi-trace determination of halogens and sulfur
We are able to determine even very low content of halogens (not fluorine) and sulfur. These analyses are carried out by the Mitsubishi TOX – 100 analyzer.
Trace and semi-trace determination of halogens:
The sample is burnt in the oxygen-argon atmosphere. Hydrogen chloride produced by sample burning flows into the titration cell where the microcoulometric titration by Ag+ ions takes place. Ag+ ions are automatically generated by Ag - electrode.
Trace and semi-trace determination of sulfur:
The sample is burnt in the oxygen-argon atmosphere. Sulfur dioxide produced by sample burning flows into the titration cell where the microcoulometric titration by I3- ions takes place.
Trace determination of sulfur is disturbed by nitrogen and halogens. If the determination has to be done, your samples cannot contain nitrogen and halogens.
Trace determination of halogens (not fluorine) is disturbed by high sulfur and nitrogen content. If the determination has to be done, your samples can contain sulfur and nitrogen up to 10 %wt. In the case of samples of unknown chemical composition, we have to do the simultaneous C, H, N, S determination at first.
3. Determination of chlorine-, bromine- and iodine content
Methods of classical argentometry are used for the determination of the halogens content. However methods are slightly modified to be able to analyse low quantity of halogens. The sample weight needed for the analysis is depended on the expected halogen content.
The sample is burnt in the oxygen atmosphere inside of the Erlenmeyer flask. Gaseous products of burning are absorbed into the working solution of hydrogen peroxide that is subsequently transfered into the titration flask. The halogen content is determined by potentiometric titration using silver nitrate as titrant.
Your sample has to be a solid and easy burnable matter.
If the estimated halogen content is bellow 5 wt% then the sample mass needed for one analysis is at least 100 mg. If the estimated halogen content is above 5 wt% then the sample amount needed for one analysis is 20 mg.
4. Phosphorus determination
The sample is burnt in the oxygen atmosphere and mineralized. The phosphorus content is determined by a modified complexometric titration.
The sample must not contain alkali earth metals.
If the estimated phosphorus content is low (approx. 0.1 wt%) then the sample amount must be at least 800 mg in one analysis!
[iduzel] => 25101
[canonical_url] => //clab.vscht.cz/oea-en
[skupina_www] => Array
(
)
[url] => /oea-en
[sablona] => stdClass Object
(
[class] => stranka_submenu
[html] =>
[css] =>
[js] =>
[autonomni] => 1
)
)
[25094] => stdClass Object
(
[nazev] => Mass Spectrometry Laboratory
[seo_title] => Mass Spectrometry Laboratory
[seo_desc] =>
[autor] =>
[autor_email] =>
[obsah] =>
Mass Spectrometry (MS) laboratory, a part of university central laboratories, provides analytical service in mass spectrometry. Mass spectra of organic substances and their mixtures are measured. Separation techniques of gas chromatography (GC) and reverse-phase liquid chromatography (RP-HPLC) are used.
Available ionization techniques
GC/MS, direct insertion probe, batch inlet:
- Electron Ionization (EI+ 70 eV)
- Methan Chemical Ionization (CI)
LC/MS, FIA (Flow Injection Analysis), RP-HPLC
- Elektrospray ionization (ESI) – positive, negative mode
- Atmospheric Pressure Chemical Ionization(APCI) - positive, negative mode
Mass spectra acquisition
- low (unit) rosolution
- high resolution – mass accuracy better than 5 ppm (2 ppm with a lock-mass)
- acqusition of MS/MS spectra available (ESI, APCI MSn available)
Mass spectra m/z range
- EI + 70 eV, CI: limited by samples stability and possibility of vaporization (usually up to 1000 Da)
- ESI, APCI: up to 4000 Da (valid for single charged ions)
Analyses
- molecular weight, elemental composition confirmation
- organic mixtures analyses (GC/MS)
- organic mixtures analyses (RP HPLC/MS, RP HPLC/UV-DAD) (consultation required)
- quantitative analyses, pollutants screening in complex matrices (consultation required)
- structure characterization – MS/MS experiments, EI+ 70eV
- GC/MS a LC/MS method development (consultation required)
Samples pre-treatment (consultation required)
- SPME, SPE, MEPS etc.
- thermal desorption (TD) – GC/MS
VOC (Volatile Organic Compounds) analyses in atmosphere or gases , emmited from materials (consultation required)
- Tedlar bag sampling
- thermal desorption tubes (e.g.TENAX) sampling
- solvent desorption tubes (e.g. ORBO, DNPH) sampling
- SUMMA cannister sampling
Analyses results
Mass spectra and additional information are provided in the form of pdf files via e-mail, raw files data are provided on a request. Mass spectra can be provided as weel as Excel or Word files including their metadata and list form.
[iduzel] => 25094
[canonical_url] => //clab.vscht.cz/ms-en
[skupina_www] => Array
(
)
[url] => /ms-en
[sablona] => stdClass Object
(
[class] => stranka_submenu
[html] =>
[css] =>
[js] =>
[autonomni] => 1
)
)
[24134] => stdClass Object
(
[obsah] =>
[iduzel] => 24134
[canonical_url] =>
[skupina_www] => Array
(
)
[url] =>
[sablona] => stdClass Object
(
[class] =>
[html] =>
[css] =>
[js] =>
[autonomni] =>
)
)
)
[iduzel] => 20082
[canonical_url] =>
[skupina_www] => Array
(
)
[url] =>
[sablona] => stdClass Object
(
[class] =>
[html] =>
[css] =>
[js] =>
[autonomni] =>
)
)
)
[sablona] => stdClass Object
(
[class] => web
[html] =>
[css] =>
[js] =>
[autonomni] => 1
)
[api_suffix] =>
)
DATA
stdClass Object
(
    [nazev] => Laboratory of X-ray Diffractometry and Spectrometry
    [seo_title] => Laboratory of X-ray Diffractometry and Spectrometry
    [seo_desc] =>
    [autor] =>
    [autor_email] =>
    [obsah] => Laboratory of X-ray diffractometry and spectrometry is part of the Central Laboratories at the University of Chemical Technology in Prague. Its main mission is the determination of phase composition using X-ray diffraction analysis(XRD) involving the measurement and evaluation of diffraction patterns and elemental composition by X-ray fluorescence analysis (XRF) of samples supplied from university departments but also from outside the university. In addition to the basic service, specialized or complex experiments, including evaluation can be performed.
X-ray powder diffraction analysis (XRPD, mineralogical analysis, phase analysis) could be used to measure solid samples in the form of powders or flat compacts to determine amorphous or crystalline state of samples. The determination of crystalline phases is performed on the base of comparison  measured d, I values with d,I values in databases PDF-4+(Powder diffraction file, inorganic measured and calculated data) or PDF-4/Organics (organic calculated data). Database PDF-4+ includes cards (reference 04-) with x,y,z coordinates of atoms, which could be used for quantitative Rietveld`s analysis.
XRD analysis is mainly used to characterise solid samples, inorganic and organic. Laboratory deals with all chemical problems having relation to solid phase, solid state reactions and heterogeneous systems. It can provide information about progress of solid state reaction, about qualitative and quantitative phase composition of solids, crystalline polymorphism, crystallite size (1-500nm), degree of crystallinity, structural perfection, texture. Special area is molecular and crystal structure of organic or inorganic compounds from single crystals, high-temperature  measurement of powders in the range 20-1400°C.
XRD became an indispensable method for studies of corrosion processes, catalytic reactions, synthesis of ceramic materials and pharmaceutic substances(API), research of semiconductors. XRD is not a trace analysis,  0.1 hm.%. is the Limit of Detection(LOD). Recommended quantity of sample for XRD is in section Service. XRD measurement is non-destructive and sample can be used for another analysis.
MicroXRD deals with spot analysis in range 0.1-2 mm. The main advantage is possibility to analyse no-plane compacts in different shapes (e.g. pipes, wires).
X-Ray fluorescent analysis is used to determine elements in range Be-U in powders or compact samples. It is possible to measure liquids as well with restriction to range F-U and worse detection limits for F-Si. Liquids are measured in cups, bottom of the cup is foil, usually 6 micrometer mylar or 4 micrometer polypropylene. Measured liquid must not react with foil, preferably having pH in range 5-7(F-Mg are measured with WD spectrometers). Thera are almost no restriction on pH and reactivity of liquid when ED spectrometer is used, but only Al-U elements can be measured. XRF is suitable for determination of more elements simultaneously (standard F-U), limit of detection generally  improves with growing atomic (proton) number, advantage is low overlap among elements, light elements Be-Si should be measured on samples with  smooth surface.  This is really necessary for Be-O. Recommended quantity of sample for XRD is in section Service. The measurement is mostly non-destructive (warning-glass may darkened). The element composition of glass, cements, ashes, clays, alloys is the main application.
X-ray single crystals diffraction is used for determination of molecular and crystal structure of organic or inorganic moleculs(up to 100 nonH atoms in asymmetric part of cell). Single crystal with size in range 100-1000microns is necessary. Growing of single crystals from solutions can be performed in laboratory, at least 50mg of sample and knowledge about solubility in different solvents is necessary.
    [submenuno] =>
    [urlnadstranka] =>
    [ogobrazek] =>
    [pozadi] =>
    [newurl_domain] => 'clab.vscht.cz'
    [newurl_jazyk] => 'en'
    [newurl_akce] => '/rtg-en'
    [newurl_iduzel] => 27383
    [newurl_path] => 1/20076/20078/20082/27383
    [newurl_path_link] => Odkaz na newurlCMS
    [iduzel] => 27383
    [platne_od] => 19.07.2018 10:37:00
    [zmeneno_cas] => 19.07.2018 10:37:15.805545
    [zmeneno_uzivatel_jmeno] => Jan Prchal
    [canonical_url] =>
    [idvazba] => 34764
    [cms_time] => 1713511849
    [skupina_www] => Array
        (
        )

    [slovnik] => Array
        (
        )

    [poduzel] => stdClass Object
        (
            [27467] => stdClass Object
                (
                    [nazev] => Laboratory of X-ray Diffractometry and Spectrometry
                    [seo_title] => Analysis and services
                    [seo_desc] =>
                    [autor] =>
                    [autor_email] =>
                    [obsah] => Performed in lab
- XRF elemental analysis of compacts(including layers), powder and liquid samples
- XRD phase analysis ov compacts(including layers), powder and liquid samples
- Element distribution (maps) from circle with Ø (20mm) even for NO-CONDUCTIVITY SAMPLES
- Determination of thickness, elemental and phase composition of layers and multilayers
- Determination of amorphous content in sample by XRD
- Determination of average crystallite size in range 1-500nm by XRD
- Phase transformation by XRD – range 278K - 1693K
- Cell parameters and stechiometrie by XRD
- Micro and macro strain by XRD
- Crystals orientation by XRD
- Determination of 3D molecular and crystal structure of small moleculs from single crystals
- Structure or quantitative analysis by Rietveld method
- Non-destructive determination of minerals even in jewels
Performed outside of lab
- XRF elemental analysis of compact, powder and liquid samples
- Determination of thickness, elemental composition of layers and multilayers
Instruments for XRF (elemental, chemical) analysis:
The measurement can be done with WD spectrometr or ED spectrometer. WD spectrometer have better resolution, lower detection limits, but restrictions on sample size.
In the case of WD spectrometers, sample must fit in cylindrical cassette – inner diameter 52mm, height 25mm (resp. up to 40mm). Circle in the CENTRE OF THE SAMPLE is analysed. The diameter of measuring circle could be changed.
IF THE SAMPLE CANNOT FIT IN CASETTE, it is possible to use portable ED spectrometer Niton XL5, only elements Mg-U and size of sample IS NOT IMPORTANT!!!,
WD XRF spectrometers: ARL 9400, Axios, PERFORM‘X
Elements F-U. Standart measurement for concentration in range 0.005%(50ppm)-100%.
ARL9400 – calibration for mask with diameter 29mm ( 9mm and 15mm without calibration).
Axios – calibration for mask with diameter 6mm, 10mm, 20mm, 25mm, 38mm.
Performix- calibration for mask with diameter 15mm, 29mm (1.5 a 3mm without calibration)
Standardless software – Uniquant 4(ARL9400- intensity measurement for 110 channels-83 elements F-U), Omnian (Axios - 11 scans-84 elementsO-U), Integrated Uniquant UQi (PERFORM‘X – intensity mesurement for 122 channels - 83 prvků F-U),
Price for standard analysis (sample preparation, data collection and evaluation) is 1000 Kč + DPH. 10 samples and more, discount 10%, discount 10% for universities and academic institutions.
Low concentrations in range 1ppm-100ppm is better consult before measurement.
Be-O determination in concentration from 2% possible, is better consult before measurement.
Determination of thickness of multilayers from 10 nm up to 100mikrometrs by XRF.
ED XRF spektrometr: Niton XL5
Niton XL5 – calibration for circle, diameter 8mm and 3mm for General Metals(GM), 8mm for Mining(M)), Plastics, Soil, Coating – measurement of thickness up to 4 layers (layers must include different elements)
Range Mg-U. Worse resolution than WD spectrometrs, possible overlap of elements (meziprvkové ovlivnění koncentrace, minoritní prvek je překryt majoritními prvky a nejen s protonovým číslem Z+-1. Standard measurement for concentrations range 0.01%-100%. Sitable for compacts, which do not fit in cassette for WD spectrometer or the measured area is small (circle diameter 8mm, or smaller 3mm) or measured area is in centre of sample Suitable for screening liquids, pH 1-14!!!
Price for standard analysis (sample preparation, data collection and evaluation) is 400 Kč + DPH. 10 samples and more, discount 10%, discount 10% for universities and academic institutions.
Instruments for XRD (phase, powder, mineralogical) analysis:
Vertical diffractometrs:
X´pert Pro (2002) – Co tube, rotational transmission/reflextion stage, sample changer for 15 samples
X'Pert3 Powder (2015) – Cu tube, rotational transmission/reflextion stage, sample changer for 15 samples eliptical focus mirror, capillary spiner, colimator for thin layers
Bruker - D8 Advance (2001) – Co tube ( Cu or Mo tube), sample changer for 7 samples
Evaluation software – Panalytical HighScore Plus 4.0
Powder samples and compact samples of different size ( preferably suitable for standard holders) can be analysed by XRD. Size of analysed place 0.1x0.1mm2 až 15x20mm2. Minimum quantity of powder sample is 1mg, standard quantity is 200mg.
Price for for standard qualitative analysis (sample preparation-100Kč, data collection-500Kč and evaluation 400Kč) is 1000 Kč + DPH. 10 samples and more, discount 10%, discount 10% for universities and academic institutions.
Instrument for microXRD analysis:
microXRD – microdiffraction system D8 Discover with 2D detector Vantec 500, laser focusing and camera – spot measurement diameter 0.1-2mm.
Price for measurement 1 spot and standard qualitative phase analysis ( data collection-500Kč and evaluation 500Kč) is 1000 Kč+DPH. 10 samples and more, discount 10%, discount 10% for universities and academic institutions.
Instrument for microXRF analysis and elemental distribution(maps):
microXRF–spot analysis with spectrometr PERFORM’X, spot diameter 1.5mm, camera system, element distribution within the circle diameter 20mm -MAPS.
Instrument for powder structure (3D- atomic positions) analysis:
Vertical difractometr:
X'Pert3 Powder ( 2015) – Cu tube, eliptical focus mirror, capillary spiner
Evaluation software – Fox, Dash, Mercury 3.0, Discovery Studio 4.0
Instrument for single crystal structure analysis:
4-cicle difractometr: XcaliburTMPX – (2004), single crystals size 0. 1 – 1mm
Evaluation software – Jana 2006, Sir 2004,Ortep, Mercury 3.0, Diamond, Platon,
Databases, regularly yearly update:
Database CSD – structures of organic substances
Databáze PDF-4+ – database d, I values of reference measured and calculated inorganic substances ( x,y,z atomic coordinates)
Databáze PDF-4/Organics – databasee d, I values of reference organic substances calculated from CSD (NO x,y,z ATOMIC COORDINATES)
[urlnadstranka] =>
[poduzel] => stdClass Object
(
[27478] => stdClass Object
(
[nazev] => Information
[barva_pozadi] => cervena
[uslideru] => false
[text] =>
Analysis and services
Contacts+staff
Instruments
XRF reports
XRD reports
XRF and XRD data collection
Sample specifications
XRD sample holders
Teaching
Research+Grant projects
Data deposition
How to cite
Quality Marks of PDF cards
Licence-PDF-4+, HighScore Plus 4
Data Viewer
[iduzel] => 27478
[canonical_url] =>
[skupina_www] => Array
(
)
[url] =>
[sablona] => stdClass Object
(
[class] => infobox
[html] =>
[css] =>
[js] =>
[autonomni] => 0
)
)
)
[iduzel] => 27467
[canonical_url] =>
[skupina_www] => Array
(
)
[url] => /rtg-en/service
[sablona] => stdClass Object
(
[class] => stranka
[html] =>
[css] =>
[js] =>
[autonomni] => 1
)
)
[27469] => stdClass Object
(
[nazev] => Laboratory of X-ray Diffractometry and Spectrometry
[seo_title] => Contacts+Staff
[seo_desc] =>
[autor] =>
[autor_email] =>
[obsah] =>
Contacts
You will find us:
University of Chemistry and Technology Prague, Technicka 5, Prague 6
The first laboratory is located in the basement, building A, room no. S38
The second laboratory is located in the 3rh floor, building A, room no. P03
Staff:
Telephone:
+420 220 444 201 , +420 730 809 852 (Maixner)
+420 220 444 080 (Pažout)
+420 220 445 023 (Randáková)
+420 220 445 024 (Kohoutková, Cibulková)
+420 220 445 043 (Krupka)
Address:
VŠCHT Praha - Central laboratories
Laboratory of Diffractometry and Spectrometry
Technická 5
166 28 Praha 6
[urlnadstranka] =>
[ogobrazek] =>
[pozadi] =>
[poduzel] => stdClass Object
(
[27487] => stdClass Object
(
[nazev] => Information
[barva_pozadi] => cervena
[uslideru] => false
[text] =>
Analysis and services
Contacts+staff
Instruments
XRF reports
XRD reports
XRF and XRD data collection
Sample specifications
XRD sample holders
Teaching
Research+Grant projects
Data deposition
How to cite
Quality Marks of PDF cards
Licence-PDF-4+, HighScore Plus 4
Data Viewer
[iduzel] => 27487
[canonical_url] =>
[skupina_www] => Array
(
)
[url] =>
[sablona] => stdClass Object
(
[class] => infobox
[html] =>
[css] =>
[js] =>
[autonomni] => 0
)
)
)
[iduzel] => 27469
[canonical_url] =>
[skupina_www] => Array
(
)
[url] => /rtg-en/contacts
[sablona] => stdClass Object
(
[class] => stranka
[html] =>
[css] =>
[js] =>
[autonomni] => 1
)
)
[27484] => stdClass Object
(
[nazev] => Laboratory of X-ray Diffractometry and Spectrometry
[seo_title] => Instruments
[seo_desc] =>
[autor] =>
[autor_email] =>
[obsah] =>
XRD - diffractometer PANanalytical Empyrean
(PANanalytical, Holland)
diffractometer Empyrean, PC controlled, Cu tube, goniometr, PC for data collection and evaluation with yearly updated database PDF-4+, PDF-4/Organics.Standard Bragg-Brentano set-up for XRD analysis - automatic variable slits, sample changer for 45 samples, 1D detector PIXCEL. Measurement range 0.6-140° - „beam knife“.Set-up for measurement of thin layers with thickness below 200nm – focusing mirror, parallel plate collimator 0.18degree + sealed 0D detektor.
More details: https://www.malvernpanalytical.com/en/products/product-range/empyrean-range/empyrean
High temperature chamber for X-Ray diffractometer (XRD)
High temperature chamber HTK1200n (Anton Paar) is available for the X-Ray diffractometer PANalytical Empyrean. High temperature limit is 1200 dgC.
For more details see:
XRD - diffractometer Bruker AXS D8
(Bruker, Germany)
diffractometer Bruker D8, PC controlled, Co(Cu or Mo tube), goniometr, automatic variable slits, rotational sample stage, sample changer for 7 samples, 1D LynxEye detector, yearly updated database PDF-4+, PDF-4/Organics, high
XRD - diffractometer PANanalytical X´Pert PRO
(PANanalytical, Holland)
diffractometer X´Pert PRO, PC controlled, Co tube, goniometr, automatic variable slits, sample changer for 15 samples, 1D XCelerator detector, yearly updated database PDF-4+, PDF-4/Organics. Measurement range 0.6-140° - „beam knife“.
XRD - diffractometer PANanalytical X'Pert3 Powder
(PANanalytical, Holland)
diffractometer X´Pert3 Powder, PC controlled, Cu tube, goniometr, automatic variable slits, sample changer for 15 samples, 1D detector PIXCEL, yearly updated database PDF-4+, PDF-4/Organics. Measurement range 0.6-140° - „beam knife“.
microXRD – microdiffraction and texture system D8 Discover with the 2D Vantech detector
(Bruker, Germany)
Microdiffraction system D8 Discover, PCr controlled, Co tube, goniometr, parallel polycapilary optic POLYCAP with primary diametr beam of 4mm, 5 long UBC collimators – diameters 0.1, 0.3, 0.5, 1 and 2mm. Compact motorized XYZ stage – load capacity 1kg, maximum height of sample 42mm, X,Y,Z –range -25mm. X-ray powder diffraction can be employed with the aim to measure powder patterns from spots of a minimum size 100 x 100 μm. The system is capable to collect Debye-Scherrer frames convertible into a standard 1D powder pattern.
XRF - spectrometer ARL 9400 XP
(Thermo ARL, Switzerland)
Fully automatic sequantial XRF spectrometer for qualitative and quantitative element analysis up to 83 elements of periodic table (B-C O-U) in the range from ppm to 100%. Possible samples – solid materials, powders, thin films and fluids. Rh tube, 4kW generator, 4 collimators, 6 crystals (AX 20, TLAP, PET, Ge 111, LiF 200, LiF 220), 2 detectors – proporcional and scintilation. Analysis using calibration curve done with software Winxrf. Standardless analysis done with program Uniquant 4.
XRF - spectrometer Axios
(PANanalytical, Holland)
Fully automatic sequantial XRF spectrometer for qualitative and quantitative element analysis up to 87 elements of periodic table (B-U) in the range from ppm to 100%. Possible samples – solid materials, powders, thin films and fluids. Rh tube, 4kW generator, 3 collimators, 8 crystals (PX1, PX4a, PX5, PX7, PE002, Ge 111, LiF 200, LiF 220), 2 detectors – proporcional and scintilation. Analysis using calibration curve done with software SuperQ 5.0. Standardless analysis done with program Omnian.
• XRF - spectrometer Performix – spot analysis(1.5mm) and mapping – circle with diameter 20mm
(Thermo ARL, Switzerland)
Fully automatic sequantial XRF spectrometer for qualitative and quantitative element analysis up to 83 elements of periodic table(Be-B O-U) in the range from ppm to 100%. Possible samples – solid materials, powders, thin films and fluids. Rh tube, 4kW generator, 4 collimators, 6 crystals (AXBeB, AX03, PET, Ge 111, LiF 200, LiF 220), 2 detectors – proporcional and scintilation. Analysis using calibration curve done with software Oxsas. Standardless analysis done with program Uniquant 5 integrated in Oxsas. Spot analysis from the 1.5mm spot.
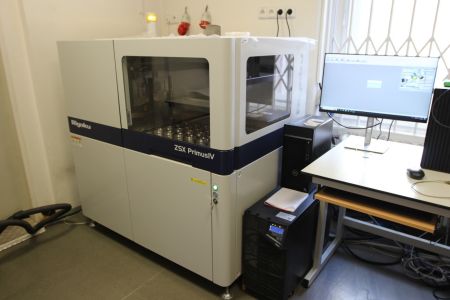
XRF - spectrometr ZSX Primus IV (Rigaku, Japonsko)
Fully automatic sequantial XRF spectrometer for qualitative, semiquantitative and quantitative element analysis up to 87 elements of periodic table (Be-U) in the range from ppm to 100%. Possible samples – solid materials, powders, thin films and fluids. Rh tube ABOVE SAMPLE=well pressed samples can be mesured without binder or foil (B-Mg measured easily and more accurately), 4kW generator, 3 collimators, 7 crystals (RX85-Be-B, RX61-C, RX40-N-O, RX26-F-Na-Mg, PET, Ge 111, LiF 200), 2 detectors – proporcional and scintilation. SEMIQUANTITATIVE standardless analysis performed with program SQX, QUANTITATIVE analysis using calibration curve performed with software SQX. More info: https://www.rigaku.com/products/wdxrf/primusiv
EDXRF portable spectrometr XL5
(Thermo)
is a device for for a qualitative, semiquantitative and quantitative element analysis in an elemental range Mg-U and in a concentration range 0.01-100%, time 120s(chemical composition, shape and size of the sample are important).
XL5 can perform fast screening of present elements in concentration above 0.1% in time of 30s.
Measured spot is the circle with the diameter of 8mm, possibility to use mask with diameter of 3mm, worse detection limits and longer time.
Sample is measured in air and in principle may have whatever dimensions. It is possible to measure small samples( better not smaller than 3mm) or larger samples (X-ray safe are samples which fit in standard desk stand, Maxsize D19xW19xH11cm). Bigger saples can be measured if the safety rules are fulfilled.
Available calibrations Mining(8mm), General Metals (3,8mm), Coating (8mm), Plastics (8mm), Soils(8mm).
http://www.hukos.cz/spektrometr-xl5/
https://www.thermofisher.com/order/catalog/product/NITONXL5
[urlnadstranka] =>
[ogobrazek] =>
[pozadi] =>
[poduzel] => stdClass Object
(
[27486] => stdClass Object
(
[nazev] => Information
[barva_pozadi] => cervena
[uslideru] => false
[text] =>
Analysis and services
Contacts+staff
Instruments
XRF reports
XRD reports
XRF and XRD data collection
Sample specifications
XRD sample holders
Teaching
Research+Grant projects
Data deposition
How to cite
Quality Marks of PDF cards
Licence-PDF-4+, HighScore Plus 4
Data Viewer
[iduzel] => 27486
[canonical_url] =>
[skupina_www] => Array
(
)
[url] =>
[sablona] => stdClass Object
(
[class] => infobox
[html] =>
[css] =>
[js] =>
[autonomni] => 0
)
)
)
[iduzel] => 27484
[canonical_url] =>
[skupina_www] => Array
(
)
[url] => /rtg-en/equipment
[sablona] => stdClass Object
(
[class] => stranka
[html] =>
[css] =>
[js] =>
[autonomni] => 1
)
)
[43496] => stdClass Object
(
[nazev] => Laboratory of X-ray Diffractometry and Spectrometry
[seo_title] => XRF reports
[seo_desc] =>
[autor] =>
[autor_email] =>
[obsah] =>
Reports from XRF spectrometrs ARL 9400, Performix and Axios–standardless analysis
Elements F-U in reports may be expressed either as elements or oxides (exceptionaly as another compounds) or as combination of elements and oxides. It is not possible in simple way from XRF analysis to judge in which chemical form are elements present in the sample (XRD can help). The value „Sum Conc's before normalisation“ may be used to help and should be 100%, if the following ias fullfiled - proper amount of sample, correct choise of chemical form of present elements and no unmeasurable elements ( H-N) in sample. The values „Sum Conc's before normalisation“ in range 98-102% are OK.
The goal of sample preparation is to achieve „Sum Conc's before normalisation“ in range 98-102%
„Sum Conc's before normalisation“ includes elements with + sign in case of spectrometrs ARL9400 and Performix and elements present in report for spectrometr Axios. Software presents elements with concentration higher than 2xStdErr, we consider more reliable if calculated concentration is higher than 3xStdErr. Operator may define the minimal reliable concentration respect to time of mesurement. It is about 30-50ppm, (resp. 0.003-0.005%) for standard measurement speed (15-20min/sample). Each element has got different detection limit, light elements F-Si are more difficult to detect.
XRF - spectrometer ARL 9400
Report for sample with elements if form of oxides – report in oxides .
Report for sample with elements if form of elementss – report in elements .
Samples may include hydrates (unmeasurable H, O). This case may be solved by heating the sample and using method LOI or less laborious and often convenient including calculation of unmeasurable rest – H2O. This is the case of impurity determination in calcium sulphate dihydrate CaSO4.2H2O . Elements of interest Zn and Pb as elements, other elements as oxides.
If Ca is present as CaCO3 than report in form oxides has got „Sum Conc's before normalisation“ smaller than 100% (e.g. 89%), which demonstrates presence of unmeasurable part, in this case CO2. Report with stochiometrically calculated CO2 has got „Sum Conc's before normalisation“ in range 98-102% (100.9%).
If Ca is present as CaCO3, CaSO4.2H2O, CaO i Ca(OH)2 than the most accurate result can be achieved by LOI (Lost On Ignition) method. We may weight such an amount of sample, that after heating we have suitable amount for XRF analysis. The simplest case is when 1g is OK, heating at proper temperature and long enough to get oxide. Than weight calcinated product and for weight 0.59g we get LOI =41. This value is inserted in program and we obtain concentration of elements as oxides in final report before heating.
Uniquant 4 will normalize all results to 100%, there is no chance to get results without normalisation.
It is possible to summarise results from more samples in Excel file – summarisation of results. Only elements of interest are usually presented for clarity.
XRF - spectrometer Performix
Report for sample with elements if form of oxides – report in oxides .
Report for sample with elements if form of elementss – report in elements .
Integrated Uniquant 5 may produce results with or without normalization.
XRF - spectrometer Axios
Report for sample with elements if form of oxides – report in oxides .
Report for sample with elements if form of elementss – report in elements .
Peak intensities from 11 measured scans are used to calculate element concentration using spectrometr Axios and standardless software Omnian. The main advantage of software Omnian respect Uniquant is possibility to check the presence of trace elements by searching the scan and with eye judging if the peak of an element is or is not present. The disadvantage is the longer time of measurement and from the statistical point of view less precise measured intensities. The significant advantage is the possibility to compare scans of more samples together in one figure.
EDXRF – portable spectrometer XL5
Determination of materiál grades – possibility to compare element composition of sample with inbuilt library of alloys (e.g. determination of material grade).
Layer thickness determination – layer thickness can be mesured in range 0.01-100 micrometrs and present in different units (micrometrs, g/cm2). Layer thickness Cu on Fe substrate.
[urlnadstranka] =>
[poduzel] => stdClass Object
(
[43540] => stdClass Object
(
[nazev] => Information
[barva_pozadi] => cervena
[uslideru] => false
[text] =>
Analysis and services
Contacts+staff
Instruments
XRF reports
XRD reports
XRF and XRD data collection
Sample specifications
XRD sample holders
Teaching
Research+Grant projects
Data deposition
How to cite
Quality Marks of PDF cards
Licence-PDF-4+, HighScore Plus 4
Data Viewer
[iduzel] => 43540
[canonical_url] =>
[skupina_www] => Array
(
)
[url] =>
[sablona] => stdClass Object
(
[class] => infobox
[html] =>
[css] =>
[js] =>
[autonomni] => 0
)
)
)
[iduzel] => 43496
[canonical_url] =>
[skupina_www] => Array
(
)
[url] => /rtg-en/xrf
[sablona] => stdClass Object
(
[class] => stranka
[html] =>
[css] =>
[js] =>
[autonomni] => 1
)
)
[43497] => stdClass Object
(
[nazev] => Laboratory of X-ray Diffractometry and Spectrometry
[seo_title] => XRD Reports
[seo_desc] =>
[autor] =>
[autor_email] =>
[obsah] =>
XRD reports
Semiquantitative analysis of Fe corrosion products, method „corund numbers“. This method does not deal with amorphous content. Co tube is suitable for samples rich on Fe and Co.
|
Ref. Code
|
Score
|
Comp.Name
|
Mineral Name
|
Chem. Formula
|
SemiQuant [%]
|
|
04-015-8209
|
59
|
Iron Oxide
|
Magnetite
|
Fe3 O4
|
Cca 25
|
|
04-015-8205
|
61
|
Iron Oxide Hydroxide
|
Goethite
|
Fe O ( O H )
|
Cca 40
|
|
01-074-6247
|
52
|
Iron Oxide Hydroxide
|
Lepidocrocite, syn
|
Fe O ( O H )
|
Cca 25
|
|
04-015-9760
|
35
|
Iron Carbonate
|
Siderite, syn
|
Fe ( C O3 )
|
Cca 10
|
Quantitative Rietveld analysis – determination of amorphous content using inner standard ZnO=7.5%.
|
Ref.Code
|
Score
|
Comp. Name
|
Mineral Name
|
Chem. Formula
|
Quant[%]
|
|
01-079-1276
|
53
|
Aluminum Silicon Oxide
|
Mullite, syn
|
Al2(Al2.8 Si1.2)O9.6
|
30.8(2)
|
|
01-070-8072
|
47
|
Zinc Oxide
|
|
Zn O
|
7.5
|
|
01-075-8320
|
42
|
Silicon Oxide
|
Quartz
|
Si O2
|
7.9(2)
|
|
01-084-2782
|
36
|
Iron Oxide
|
Magnetite
|
Fe3 O4
|
2.06(2)
|
|
01-071-1166
|
14
|
TitaniumOxide
|
Anatase
|
Ti O2
|
1.26(2)
|
|
01-073-1765
|
25
|
TitaniumOxide
|
Rutile, syn
|
Ti O2
|
0.88(2)
|
|
01-079-0007
|
36
|
Iron Oxide
|
Hematite, syn
|
Fe2 O3
|
1.26(2)
|
|
|
|
Amorphous
|
|
|
48.8(2)
|
Crystallite size determination of Anatase in different crystallographic directions by application of Wiliamson-Hall plot.
|
Pos. [°2Th.]
|
d-spacing[A]
|
Height [cts]
|
R.I. [%]
|
h k l
|
Crys.Size[A]
|
Matched by
|
|
25.28(3)
|
3.51939
|
33621(89)
|
100.00
|
1 0 1
|
264
|
04-007-0701
|
|
|
|
|
|
|
|
|
|
36.90(1)
|
2.43228
|
2126(36)
|
6.32
|
1 0 3
|
248
|
04-007-0701
|
|
|
|
|
|
|
|
|
|
37.78(6)
|
2.37944
|
8401(72)
|
24.99
|
0 0 4
|
221
|
04-007-0701
|
|
|
|
|
|
|
|
|
|
38.60(3)
|
2.33334
|
2618(325)
|
7.79
|
1 1 2
|
252
|
04-007-0701
|
|
|
|
|
|
|
|
|
|
48.01(9)
|
1.89322
|
15900(283)
|
47.29
|
2 0 0
|
277
|
04-007-0701
|
|
|
|
|
|
|
|
|
|
53.9(3)
|
1.70057
|
9319(84)
|
27.72
|
1 0 5
|
227
|
04-007-0701
|
|
|
|
|
|
|
|
|
|
55.04(5)
|
1.66717
|
10009(242)
|
29.77
|
2 1 1
|
250
|
04-007-0701
|
|
|
|
|
|
|
|
|
|
62.00(5)
|
1.49342
|
1458(370)
|
4.34
|
2 1 3
|
292
|
04-007-0701
|
|
|
|
|
|
|
|
|
|
62.70(4)
|
1.48124
|
7093(317)
|
21.10
|
2 0 4
|
280
|
04-007-0701
|
|
|
|
|
|
|
|
|
|
69.00(1)
|
1.36420
|
3235(296)
|
9.62
|
1 1 6
|
202
|
04-007-0701
|
|
|
|
|
|
|
|
|
|
70.00(1)
|
1.33872
|
3511(47)
|
10.44
|
2 2 0
|
216
|
04-007-0701
|
|
|
|
|
|
|
|
|
[urlnadstranka] =>
[poduzel] => stdClass Object
(
[43545] => stdClass Object
(
[nazev] => information
[barva_pozadi] => cervena
[uslideru] => false
[text] =>
Analysis and services
Contacts+staff
Instruments
XRF reports
XRD reports
XRF and XRD data collection
Sample specifications
XRD sample holders
Teaching
Research+Grant projects
Data deposition
How to cite
Quality Marks of PDF cards
Licence-PDF-4+, HighScore Plus 4
Data Viewer
[iduzel] => 43545
[canonical_url] =>
[skupina_www] => Array
(
)
[url] =>
[sablona] => stdClass Object
(
[class] => infobox
[html] =>
[css] =>
[js] =>
[autonomni] => 0
)
)
)
[iduzel] => 43497
[canonical_url] =>
[skupina_www] => Array
(
)
[url] => /rtg-en/xrd
[sablona] => stdClass Object
(
[class] => stranka
[html] =>
[css] =>
[js] =>
[autonomni] => 1
)
)
[43498] => stdClass Object
(
[nazev] => Laboratory of X-ray Diffractometry and Spectrometry
[seo_title] => XRF and XRD data colection
[seo_desc] =>
[autor] =>
[autor_email] =>
[obsah] =>
XRD and XRF data collection
Ambient temperature X-ray diffraction analysis
X-ray powder diffraction data were collected at room temperature with a Bruker AXS D8 θ-θ powder diffractometer with parafocusing Bragg-Brentano geometry using CoKα radiation (λ = 1.79028 Å, U = 34 kV, I = 20 or 30 mA). Data were scanned with an ultrafast detector LynxEye over the angular range 5-60° (2θ) with a step size of 0.0196° (2θ) and a counting time of 19.2 s step-1. Data evaluationwere performed in the software package HighScore Plus 4.0.
X-ray powder diffraction data were collected at room temperature with an X'Pert PRO θ-θ powder diffractometer with parafocusing Bragg-Brentano geometry using CoKα radiation (λ = 1.79028 Å, U = 35 kV, I = 40 mA). Data were scanned with an ultrafast detector X'Celerator (or with a scintilator detector equipped with a secondary curved monochromator) over the angular range 5-60° (2θ) with a step size of 0.017° (2θ) and a counting time of 20.32 s step-1. Data evaluation was performed in the software package HighScore Plus 4.0.
X-ray powder diffraction data were collected at room temperature with an X'Pert3 Powder θ-θ powder diffractometer with parafocusing Bragg-Brentano geometry using CuKα radiation (λ = 1.5418 Å, U = 40 kV, I = 30 mA). Data were scanned with an ultrafast detector 1D detector PIXCEL over the angular range 5-60° (2θ) with a step size of 0.013° (2θ) and a counting time of 56.86 s step-1. Data evaluation was performed in the software package HighScore Plus 4.0.
High temperature X-ray diffraction analysis
Temperature dependent X-ray powder diffraction (TDXD) was carried out with a Bruker AXS D8 θ-θ powder diffractometer with parafocusing Bragg-Brentano geometry using CoKα radiation (λ = 1.79028 Å, U = 34 kV, I = 30 mA). The sample was placed on a Pt/Rh ribbon in a MRI high-temperature oven-camera and VPSlits were used to fix the constant irradiated length (20 mm). Data were scanned with an ultrafast detector LynxEye over the angular range 3-38° (2θ) with a step size of 0.0196° (2θ) and a counting time of 58.6 s step-1. The heating and cooling process was controlled by Eurotherm 2404. The sample was heated and cooled with rate 10 °C/min.
MicroXRD – microdiffraction system D8 Discover with 2D Vantech detector
Sample is placed on XYZ programmable stage with X,Y,Z translations in range 0-25mm. The maximum weight of the sample is 2 kg, height 50mm. X-ray powder diffraction data from microspot were collected at room temperature with an D8 Discover microdiffraction system with parallel geometry using CoKα radiation (λ = 1.7903 Å, U = 35 kV, I = 40 mA). Two images (Debye-Scherrer frames) were collected in θ-θ geometry for 2θ = 26°, 56° with 2D detector Vantech and counting time of 30min per image. Debye-Scherrer frames were converted into a standard 1D powder pattern in the software package Bruker EVA 4.0.
WD-XRF analysis
An ARL 9400 XP sequential WD-XRF spectrometer was used to perform XRF analysis. It is equipped with a Rh anode end-window X-ray tube type 4GN fitted with 50 μm Be window. All peak intensity data were collected by software WinXRF in vacuum. The generator settings-collimator-crystal-detector combinations were optimised for all 82 measured elements with analysis time of 6s per element. The obtained data were evaluated by standardless software Uniquant 4. The analyzed powders were pressed into pellets about 5mm thick and diameter of 40 mm without any binding agent (or with Dentakryl as binding agent if F,O,N,C,B elements must be measured or sample does not stick together by pressing) and covered with 4 μm supporting polypropylene (PP) film. The time of measurement was about 15 min.
An Axios sequential WD-XRF spectrometer was used to perform XRF analysis. It is equipped with a Rh anode end-window X-ray tube type 4GN fitted with 75 μm Be window. All peak intensity data were collected by software SuperQ 5.0 in vacuum. The generator settings-collimator-crystal-detector combinations were optimized for collecting 11 scans for all 83 measured elements, for a lot of elements are more than one X-ray line available. The obtained data were evaluated by standardless software Omnian. The analysed powders were pressed into pellets about 5mm thick and diameter of 40 mm without any binding agent (or with Dentakryl as binding agent if F,O,N,C,B elements must be measured or sample does not stick together by pressing) and covered with 4 μm supporting polypropylene (PP) film. The time of measurement was about 20 min. Axios can be used to measure SMALL samples, but having one dimension at least 6mm.
MicroXRF analysis – spot analysis and mapping of elemental distribution
The ARL PERFORM’X is sequential WD-XRF spectrometer capable to perform standard XRF analysis (like ARL 9400XP) and furthermore spot and mapping analysis from 1.5mm spot. It is equipped with a Rh anode end-window X-ray tube type 4GN fitted with 50 μm Be window. All peak intensity data were collected by software Oxsas in vacuum. The generator settings-collimator-crystal-detector combinations were optimized for all 82 measured elements with analysis time of 6s per element. The obtained data were evaluated by standardless software Uniquant 5 integrated in Oxsas. The analyzed powders were pressed into pellets about 5mm thick and diameter of 40 mm without any binding agent (or with Dentakryl as binding agent if Fluorine is important) and covered with 4 μm supporting polypropylene (PP) film. The time of measurement was about 15 min.
Spot analysis can be performed from the narrow spot of 1.5mm selectable with on-board camera. The time of measurement can be adjusted respect to required detection limits and number of measured elements, 60 min/sample is necessary for Na-U elements to detect concentration above 0.05%.
X-ray mapping capability provides complete elemental visualization of complex non-homogenous surfaces, characterization of elemental impurities and inclusions.
LOI method - sample preparation for XRF
Method LOI (Loss On Ignition) can be used for accurate elemental concentration in the case when sample contains unmeasurable elements - C,H,N,O). About 1g of sample was weighted ,heated at proper temperature (temperature depends on sample chemistry – to get rid of H2O - oven drying at 100-140°C, to burn organic components – heating at 200-250°C, to remove CO2 and change carbonates in oxides –heating at 800°C for about 10min and to weight again. Than the product after heating is analysed and the weight difference (LOI) is used as known value in program Uniquant. Suitable temperature and time of heating can be found by TGA and DTA.
LeNeo Fluxer
LeNeo fluxer is used to prepare glass discs – „beds“ suitable for XRF analysis.
[urlnadstranka] =>
[poduzel] => stdClass Object
(
[43548] => stdClass Object
(
[nazev] => information
[barva_pozadi] => cervena
[uslideru] => false
[text] =>
Analysis and services
Contacts+staff
Instruments
XRF reports
XRD reports
XRF and XRD data collection
Sample specifications
XRD sample holders
Teaching
Research+Grant projects
Data deposition
How to cite
Quality Marks of PDF cards
Licence-PDF-4+, HighScore Plus 4
Data Viewer
[iduzel] => 43548
[canonical_url] =>
[skupina_www] => Array
(
)
[url] =>
[sablona] => stdClass Object
(
[class] => infobox
[html] =>
[css] =>
[js] =>
[autonomni] => 0
)
)
)
[iduzel] => 43498
[canonical_url] =>
[skupina_www] => Array
(
)
[url] => /rtg-en/data
[sablona] => stdClass Object
(
[class] => stranka
[html] =>
[css] =>
[js] =>
[autonomni] => 1
)
)
[43499] => stdClass Object
(
[nazev] => Laboratory of X-ray Diffractometry and Spectrometry
[seo_title] => samples specifications
[seo_desc] =>
[autor] =>
[autor_email] =>
[obsah] =>
XRD phase (mineralogical) analysis
X-Ray powder diffraction analysis (mineralogical analysis) could be used to measure solid samples in the form of powders or flat compact samples to determine amorphous or crystalline state of samples. The determination of crystalline phases is performed on the base of comparison measured d,I values with d,I values in database PDF-4+ (Powder Diffraction File – measured inorganic and organic substances, calculated inorganics), PDF-4/Organics (calculated organics). Database PDF-4+ includes even cards (reference 01-, 04-) including x,y,z atomic coordinates, which could be used for quantitative Rietveld`s analysis.
Requirements on samples for standard XRD phase analysis (Sample Changer)
XRD could be used to measure powders or compact samples (certain restriction on size, thickness and weight of the sample – unusual sample better discuss with lab staff). The measured surface of the sample should be flat. Samples like pipes, wires could be measured, but the data quality is lower than in the case of ideal sample (flat, thick enough that no X-Ray will go through the sample). Powders are measured in cylindrical holders, at least 200 mg is necessary depending on the density of the sample, higher density more sample is necessary. Goal is to fill circle cavity with diameter 26 mm and depth of 1 mm. Maximal irradiated size by X-Ray is 20x15 mm. Holders with smaller diameter than 26 mm or lower depth than 1mm can be used to measure smaller amount of sample, but the quality of data will get worse. Powder pattern can be collected from 1 mg of sample spread on the „low background“ holder made of properly cut Si wafer. Polymeric foils could be measured from the thickness of 1micrometr.
Requirements on samples for microdiffraction analysis
The quality of powder patterns (intensity of diffraction lines and their width –FWHM) depends on the amount of irradiated sample. The powder pattern obtained from well powdered sample of 10 mg collected by standard X-Ray diffraction is better than from microdiffraction!!! Microdiffraction analysis is useful when the amount of sample is lower than 10 mg or we need to measure spots with size 0.1-2mm on compact samples. Microdiffraction analysis is useful in the case of compact samples, the maximal height of sample is 42 mm (bigger height – better discuss with lab staff) and the maximal weight 1kg. Microdiffraction analysis could be performed on ANY CURVED SAMPLES! USEFUL WHEN SAMPLE MUST NOT BE DESTROYED. Masured spots could be almost anywhere on the sample.
Requirements for measurement of hygroscopic samples
Hygroscopic samples or liquids with floating crystallites can be measured in capillaries with inner diameter 0.3-2mm. Capillary is horizontally placed in rotation stage. It is necessary to have about 50mg of powder.
X-Ray fluorescent analysis (XRF)
X-Ray fluorescent analysis is used to determine elements in range Be-U in powders or compact samples. It is possible to measure liquids as well with restriction to range Na-U and worse detection limits for Na-Si. Liquids are measured in cups, bottom of the cup is foil, usually 6 micrometer mylar or 4 micrometer polypropylen. Measured liquid must not react with foil, should have pH in range 5-7. XRF is suitable for determination of more elements simultaneously (standard F-U), limit of detection generally improves with growing atomic (proton) number, advantage is low overlap among elements, light elements Be-Si should be measured on samples with smooth surface. This is really necessary for Be-O.
Requirements for sample preparation
The measured surface of the sample should be flat and the size of the sample should cover the circle hole with diameter of 29 mm to get the best data. Smaller samples up to the diameter of 6 mm could be measured but measured element intensities are proportional to irradiated area. Samples like pipes, wires could be measured, but better discuss them with lab staff. Powders are pressed into the pellets with diameter of 40 mm, the diameter of pressed sample is 34 mm.
- powders – amount depends on density of the sample – 1g is appropriate (in the case of cements is about 0.7 g OK), well powdered (size of grains about 10 mm or less).Goal is to fill circle cavity with diameter 34 mm and depth of 1 mm.
- smaller amount of sample could be measured, if the sample is not thick enough or the area is smaller than optimal – result is semi-quantitative analysis from amount up to 10mg, only major elements (concentration > 1%) can be obtained from 1 mg sample
- Compact samples should fit in cylindrical cassette with inner diameter of 52 mm and max height of 25 mm.
- Irregular shapes of compact samples are better discussed with lab staff, some sample preparation will be necessary.
- liquids – optimal amount 5-15 ml, pH in range 5-7, measured elements Na-U(WD spectrometer), worse LOD for light elements Na-Si (mylar or polypropylene foil absorbs X-Ray of light elements), less accurate than AAS for concentrations lower than 0.5%, for higher concentrations more accurate than AAS, not very suitable for measurement of smaller number of elements than 3, suitable for screening of elements in liquids. Foil at the bottom of the cup must not react with measured liquid.
- Liquids with no restriction on pH (0-14), optimal amount 1 ml, measured elements Al-U(ED spectrometer), LOD about 0.1%.elements are measured simultaneously 30-120s.
- Think layers on the filtration paper
- Sample is difficult to press, it means. sample does not stick together or not stick to the support from boric acid - sample could be measured as liquid (worse LOD for light elements Na-Si) or sample must be mixed with some kind of binding agent( e.g.metacrylate)
- Accurate and precise quantitative analysis can be achieved with the calibration curves using standards. The best results are achieved with preparation samples into the glass disks so called „beads“ by melting the sample with suitable flux (e.g.lithium tetraborate) (fusion changes sample into the amorphous glass, eliminates diffraction - so called mineralogical effect)
[urlnadstranka] =>
[poduzel] => stdClass Object
(
[43549] => stdClass Object
(
[nazev] => Information
[barva_pozadi] => cervena
[uslideru] => false
[text] =>
Analysis and services
Contacts+staff
Instruments
XRF reports
XRD reports
XRF and XRD data collection
Sample specifications
XRD sample holders
Teaching
Research+Grant projects
Data deposition
How to cite
Quality Marks of PDF cards
Licence-PDF-4+, HighScore Plus 4
Data Viewer
[iduzel] => 43549
[canonical_url] =>
[skupina_www] => Array
(
)
[url] =>
[sablona] => stdClass Object
(
[class] => infobox
[html] =>
[css] =>
[js] =>
[autonomni] => 0
)
)
)
[iduzel] => 43499
[canonical_url] =>
[skupina_www] => Array
(
)
[url] => /rtg-en/samples
[sablona] => stdClass Object
(
[class] => stranka
[html] =>
[css] =>
[js] =>
[autonomni] => 1
)
)
[43500] => stdClass Object
(
[nazev] => Laboratory of X-ray Diffractometry and Spectrometry
[seo_title] => Sample Holders
[seo_desc] =>
[autor] =>
[autor_email] =>
[obsah] =>
Sample holders for Sample Changer- diffractometrs XPert and Powder
Compacts can be measured in sample changer if their thickness is < 6mm. Samples thicker than 6mm can not be measured in sample changer and must be measured individually (one by one, which is time consuming, non-effective). We preferr samples which fit in sample changer – thickness < 6mm.
If the sample thickness is < 5mm, THAN the sample may be placed in one of the three „circular holders“ – 943001813261, 943001813211, 943001813401 - Sample Holders XRD.pdf if the sample fulfills further size requirements. Fixing sample in circular holder guarantees PRECISE SAMPLE HEIGHT in the centre of goniometr – 2θ peak positions on powder patterns will depend ONLY on measured sample and no on its position in goniometr.
To get the right size of sample please PRINT!!! attached file sample size to fit holders.pdf and when printing you must CLICK possibility „real size“ and REMEASURE size correctness on printed pictures.
If the size of compacts do not fullfil requirements or fixing in circular holder, we can use holder for Non-standard samples 943001812001(inner diameter 43mm, maximal height 6mm).Sample fill be fixed in “correct height” by plasticine, but the compact surface will not be accurately placed in the centre of goniometr (differences are small, but do exist and occurre randomly), 2θ peak positions on powder patterns will depend not only on the sample, but on “precision” of fixing compact by plasticine. Disadvantage – 2θ peak positions of the same phase will not be in the same positions for different samples.
[urlnadstranka] =>
[poduzel] => stdClass Object
(
[43550] => stdClass Object
(
[nazev] => Information
[barva_pozadi] => cervena
[uslideru] => false
[text] =>
Analysis and services
Contacts+staff
Instruments
XRF reports
XRD reports
XRF and XRD data collection
Sample specifications
XRD sample holders
Teaching
Research+Grant projects
Data deposition
How to cite
Quality Marks of PDF cards
Licence-PDF-4+, HighScore Plus 4
Data Viewer
[iduzel] => 43550
[canonical_url] =>
[skupina_www] => Array
(
)
[url] =>
[sablona] => stdClass Object
(
[class] => infobox
[html] =>
[css] =>
[js] =>
[autonomni] => 0
)
)
)
[iduzel] => 43500
[canonical_url] =>
[skupina_www] => Array
(
)
[url] => /rtg-en/holders
[sablona] => stdClass Object
(
[class] => stranka
[html] =>
[css] =>
[js] =>
[autonomni] => 1
)
)
[43502] => stdClass Object
(
[nazev] => Laboratory of X-ray Diffractometry and Spectrometry
[seo_title] => Teaching
[seo_desc] =>
[autor] =>
[autor_email] =>
[obsah] =>
Teaching in laboratory
Here you can download texts for topics RTG phase analysis I and RTG phase analysis II. Lectures for RTG phase analysis I download here.
Details about crystallography, X-Ray diffraction and Single Crystal X-Ray Diffraction
https://en.wikipedia.org/wiki/X-ray_crystallography
Details about X-Ray Powder diffraction (XRPD)
https://en.wikipedia.org/wiki/Powder_diffraction
Details about X-Ray Fluorescence Analysis (XRF)
https://en.wikipedia.org/wiki/X-ray_fluorescence
X-Ray diffraction analysis is a method based on elastic(non photon) scattering of X-Ray radiation on the atoms electrons. The diffraction peaks (maximas) arises after scattering and interferention due to periodically regular atoms arrangement in crystalline phase. Their positions, intensity and shape depends on proton number of atoms and perfectness of their arrangement in 3D space. Investigation of the diffraction pattern makes possible to study crystalline composition of sample and its microstructure.
X-Ray spectral analysis is a method based on interaction of X-Ray with the atoms electrons consisting in absorption of X-Ray photon and following excitation of electron preferably from K level to the highest free energetic level and then transition to basic state by emitting characteristic photons for K, L etc. series of that atom. Method is possible to give elemental composition for solid and liquid samples.
[urlnadstranka] =>
[poduzel] => stdClass Object
(
[43541] => stdClass Object
(
[nazev] => Information
[barva_pozadi] => cervena
[uslideru] => false
[text] =>
Analysis and services
Contacts+staff
Instruments
XRF reports
XRD reports
XRF and XRD data collection
Sample specifications
XRD sample holders
Teaching
Research+Grant projects
Data deposition
How to cite
Quality Marks of PDF cards
Licence-PDF-4+, HighScore Plus 4
Data Viewer
[iduzel] => 43541
[canonical_url] =>
[skupina_www] => Array
(
)
[url] =>
[sablona] => stdClass Object
(
[class] => infobox
[html] =>
[css] =>
[js] =>
[autonomni] => 0
)
)
)
[iduzel] => 43502
[canonical_url] =>
[skupina_www] => Array
(
)
[url] => /rtg-en/teaching
[sablona] => stdClass Object
(
[class] => stranka
[html] =>
[css] =>
[js] =>
[autonomni] => 1
)
)
[43503] => stdClass Object
(
[nazev] => Laboratory of X-ray Diffractometry and Spectrometry
[seo_title] => Grants
[seo_desc] =>
[autor] =>
[autor_email] =>
[obsah] =>
Grant projects - cooperation
MPO-FV30062-Možnosti využití deponovaných popílků z uhelných elektráren, kooperace, ČEZ Energetické produkty, s.r.o, kooperace s Ústav skla a keramiky, 2018-2020
MPO-FV30062-Possible exploitation of deposited ashes from coal power stations, ČEZ Energetické produkty, s.r.o, cooperation with Department of Glass and Ceramics, 2018-2020
DG18P02OVV028 Technologie ošetření a identifikace degradačních procesů keramických nálezů z hradčanských paláců - Metody restaurování a konzervování pórovité i slinuté keramiky a porcelánu, kooperace s Ústav skla a keramiky, 2018-2020
DG18P02OVV028 Technology of Treatment and Identification of Degradation Processes of Ceramic Finds from Hradčany Palaces - Methods of Restoration and Conservation of Porous and Dense Ceramics and Porcelain, cooperation with cooperation with Department of Glass and Ceramics, 2018-2020
RFCS 216427832 – Inovativní zúsob nakládání s uhelnými vedlejšími produkty uhelného zpracování vedoucí rovněž k redukci CO2 emisí. European Commission Research Fund for Coal and Steel, kooperace s Ústav plynných a pevných paliv a ochrany ovzduší, 2017-2020
RFCS 216427832 - Innovative management of COAL BY-PROducts leading also to CO2 emissions reduction, European Commission Research Fund for Coal and Steel, cooperation with Department of Gaseous and Solid Fuels and Air Protection, 2017-2020
GA18-17899S Částečně a plně slinutá keramika - příprava, mikrostruktura, vlastnosti, modelování a teorie slinování, kooperace s Ústav skla a keramiky, 2018-2020
GA18-17899S Partly and fully sintered ceramics - preparation, microstructure, properties, simulations and sintering theory, cooperation with cooperation with Department of Glass and Ceramics, 2018-2020
[urlnadstranka] =>
[poduzel] => stdClass Object
(
[43542] => stdClass Object
(
[nazev] => Information
[barva_pozadi] => cervena
[uslideru] => false
[text] =>
Analysis and services
Contacts+staff
Instruments
XRF reports
XRD reports
XRF and XRD data collection
Sample specifications
XRD sample holders
Teaching
Research+Grant projects
Data deposition
How to cite
Quality Marks of PDF cards
Licence-PDF-4+, HighScore Plus 4)
Data Viewer
[iduzel] => 43542
[canonical_url] =>
[skupina_www] => Array
(
)
[url] =>
[sablona] => stdClass Object
(
[class] => infobox
[html] =>
[css] =>
[js] =>
[autonomni] => 0
)
)
)
[iduzel] => 43503
[canonical_url] =>
[skupina_www] => Array
(
)
[url] => /rtg-en/grants
[sablona] => stdClass Object
(
[class] => stranka
[html] =>
[css] =>
[js] =>
[autonomni] => 1
)
)
[43504] => stdClass Object
(
[nazev] => Laboratory of X-ray Diffractometry and Spectrometry
[seo_title] => Data deposition
[seo_desc] =>
[autor] =>
[autor_email] =>
[obsah] =>
Data deposition
Measured data from all equipment are regularly archived, at least annually. The data are sent to the customer by mail and it is customer‘s responsibility to archive his data. Employes and students of UCT are required to COLLECT THEIR SAMPLES AS SOON AS POSSIBLE!!!, when they receive the data.
[urlnadstranka] =>
[poduzel] => stdClass Object
(
[43543] => stdClass Object
(
[nazev] => Information
[barva_pozadi] => cervena
[uslideru] => false
[text] =>
Analysis and services
Contacts+staff
Instruments
XRF reports
XRD reports
XRF and XRD data collection
Sample specifications
XRD sample holders
Teaching
Research+Grant projects
Data deposition
How to cite
Quality Marks of PDF cards
Licence-PDF-4+, HighScore Plus 4
Data Viewer
[iduzel] => 43543
[canonical_url] =>
[skupina_www] => Array
(
)
[url] =>
[sablona] => stdClass Object
(
[class] => infobox
[html] =>
[css] =>
[js] =>
[autonomni] => 0
)
)
)
[iduzel] => 43504
[canonical_url] =>
[skupina_www] => Array
(
)
[url] => /rtg-en/deposit
[sablona] => stdClass Object
(
[class] => stranka
[html] =>
[css] =>
[js] =>
[autonomni] => 1
)
)
[27468] => stdClass Object
(
[nazev] => Laboratory of X-ray Diffractometry and Spectrometry
[seo_title] => How to cite
[seo_desc] =>
[autor] =>
[autor_email] =>
[obsah] =>
Important citation
Software for single crystals structure solution and refinement
SIR92
Altomare, A.; Cascarano, G.; Giacovazzo, C.; Guagliardi, A.; Burla, M.C; Polidori, G.; Camalli, M.: SIR92 – a program for automatic solution of crystal structures by direct methods. J. Appl. Crystallogr. 27 (1994) 435.
CRYSTALS
Betteridge, P. W.; Carruthers, J. R.; Cooper, R. I.; Prout, K.; Watkin, D. J.: CRYSTALS version 12: software for guided crystal structure analysis. J. Appl. Crystallogr. 36 (2003) 1487.
ORTEP-III
Farrugia, L. J.: ORTEP-3 for Windows – a version of ORTEP-III with a Graphical User Interface (GUI). J. Appl. Crystallogr. 30 (1997) 565.
Software for powder data structure solution and refinement
EXPO2004
Altomare,A., Caliandro,R., Camalli,M., Cuocci,C., Giacovazzo, C., Moliterni, A.G. G., and Rizzi, R.(2004c). "Automatic structure determination from powder data with EXPO2004,"J. Appl. Crystallogr. 37, 1025–1028.
CRYSFIRE
Shirley, R. (1999). http://www.ccp14.ac.uk/tutorial/crys/program/crysfire.htm
FOX
Favre-Nicolin, V. and Černý, R. (2002). "FOX, 'Free Objects for Crystallography:' A mo-dular approach to ab initio structure determination from powder diffraction," J. Appl. Crystallogr. 35, 734–743.
GSAS
A.C. Larson, R.B. Van Dreele, "General Structure Analysis System (GSAS)", Los Alamos National Laboratoy Report LAUR 86-748 (2000).
B.H. Toby, "EXPGUI, a graphical user interface for GSAS", J.Appl.Crys.34, 210-21 (2001).
HighScore Plus, Full Powder Pattern Analysis Software, V4.0, PANALYTICAL, Almelo, Holland
Databases
CSD -Cambridge Structure Database (CCDC-Cambridge Crystallographic Database Centrum)
Allen, F.H.: The Cambridge Structural Database: a quarter of a million crystal structures and rising, B58 (2002) 380-388
ICSD-Inorganic Structure Database (FIZ-Fachinformation zentrum, Karlsruhe)
Bergerhoff,G., Hundt, R. Sievers, R., Brown, I.D.: The Inorganic Crystal Structure Data Base. J.Chem.Inform.Comput.Sci. 23 (1983) 66-69
PDF-4+(2018) – Powder diffraction File (ICDD- International Centre for Diffraction Data)
ICDD (2018)."Powder Diffraction File," International Centre for Diffraction Data, edited by S.Kabekkodu, 12 Campus Boulevard, Newton Square, Pennsylvania 19073-3272.
[urlnadstranka] =>
[poduzel] => stdClass Object
(
[27482] => stdClass Object
(
[nazev] => Information
[barva_pozadi] => cervena
[uslideru] => false
[text] =>
Analysis and services
Contacts+staff
Instruments
XRF reports
XRD reports
XRF and XRD data collection
Sample specifications
XRD sample holders
Teaching
Research+Grant projects
Data deposition
How to cite
Quality Marks of PDF cards
Licence-PDF-4+, HighScore Plus 4
Data Viewer
[iduzel] => 27482
[canonical_url] =>
[skupina_www] => Array
(
)
[url] =>
[sablona] => stdClass Object
(
[class] => infobox
[html] =>
[css] =>
[js] =>
[autonomni] => 0
)
)
)
[iduzel] => 27468
[canonical_url] =>
[skupina_www] => Array
(
)
[url] => /rtg-en/measurements
[sablona] => stdClass Object
(
[class] => stranka
[html] =>
[css] =>
[js] =>
[autonomni] => 1
)
)
[43505] => stdClass Object
(
[nazev] => Laboratory of X-ray Diffractometry and Spectrometry
[seo_title] => Quality Marks
[seo_desc] =>
[autor] =>
[autor_email] =>
[obsah] =>
QUALITY MARKS (QM) PDF cards have quality marks to indicate how reliable the data is.
Star (S, +). Indicates the pattern represents high-quality diffractometer data. The chemical composition has been well characterized. The intensities have been measured objectively and no serious systematic errors exist. No un-indexed, space group extinct or impurity reflections are present. The average Δ2Θ (difference between measured 2 Θ and calculated 2Θ from unit cell) is less than 0,03 deg for qualifying (measured) reflections.
(Good range and an even spread of intensity. Completeness of a pattern is sensible when factors such as pseudosymmetry are taken into account. Each reflection with d-value less than or equal to 2.500A has at least 3 significant figures after the decimal point. Reflections with d-value less than or equal to 1.2000A have at least 4 significant figures after the decimal point).
Indexed (I). Indicates the pattern has been indexed (thus is almost certainly single phase) and no serious systematic errors exist. The maximum number of un-indexed, space group extinct or impurity reflections is two, but none of these reflections is among the strongest eight lines. The average Δ2Θ is less than 0,06 deg for qualifying reflections.
(There is a reasonable range and even spread in intensities. Completeness of the pattern is sen-sible. Reflections with d-value less than or equal to 2.000A have at least three significant figures after the decimal point. No qualifying reflection has an absolute Δ2Θ greater than or equal to 0.20 degrees).
Blank (B). Indicates the pattern does not meet the Star, Indexed, or Low-Precision criteria.
Doubtful (O, ?). Indicates the diffraction data have been taken on poorly characterized material and commonly no unit cell is reported. It is known or suspected problems such as preferred orientation or the data to be of low precision. The number of un-indexed, space group extinct or impurity reflections is three or more. One of the three strongest reflections is un-indexed.
(Data from a multi-phase mixture. Data from a phase poorly-characterized chemically. The "O" quality mark is commonly assigned to patterns for which no unit cell is reported unless qualifying information indicates a single-phase material. Usually, the editor has inserted a comment to explain why the "O" was assigned. For patterns with a unit cell, the following parameters are used to suggest the presence of two of more phases).
Calculated (C). Indicates the powder pattern was calculated from single-crystal structural parameters, for which the structural refinement R-factor was < 0.10. C patterns generally have very precise d-values, but the intensities may not reflect what is obtained in an experimental pattern.
Rietveld (R). Indicates the d-values are directly the result of Rietveld refinement of the data.
Hypothetical (H). Indicates the structure is calculated theoretically from the atomic positions and thermal parameters of an isostructural compound.
[urlnadstranka] =>
[poduzel] => stdClass Object
(
[43544] => stdClass Object
(
[nazev] => Information
[barva_pozadi] => cervena
[uslideru] => false
[text] =>
Analysis and services
Contacts+staff
Instruments
XRF reports
XRD reports
XRF and XRD data collection
Sample specifications
XRD sample holders
Teaching
Research+Grant projects
Data deposition
How to cite
Quality Marks of PDF cards
Licence-PDF-4+, HighScore Plus 4
Data Viewer
[iduzel] => 43544
[canonical_url] =>
[skupina_www] => Array
(
)
[url] =>
[sablona] => stdClass Object
(
[class] => infobox
[html] =>
[css] =>
[js] =>
[autonomni] => 0
)
)
)
[iduzel] => 43505
[canonical_url] =>
[skupina_www] => Array
(
)
[url] => /rtg-en/quality
[sablona] => stdClass Object
(
[class] => stranka
[html] =>
[css] =>
[js] =>
[autonomni] => 1
)
)
[43506] => stdClass Object
(
[nazev] => Laboratory of X-ray Diffractometry and Spectrometry
[seo_title] => PDF4+ license
[seo_desc] =>
[autor] =>
[autor_email] =>
[obsah] =>
PDF4+ database licencing
The PDF4+ or PDF2 databases including d, I values of crystalline substances are necessary for qualitative and quantitative evaluation of powder data. PDF4+ database can be purchased from ICDD and the new-single licence for an academic user costs 5875$. The database is operational only for one year and then a yearly update must be purchased 1250$.
Laboratory of X-ray diffractometry and spectrometry has available Master (Site) licenci. This licence costs for academic institutions also 5875$ and yearly update 1250$. If an academic institution owns the Master (Site) licence, than it is possible to buy unlimited number of additional licences for 1250$ and yearly update 495$.
Laboratory of X-ray diffractometry and spectrometry takes an active part in PDF4+ database expansion and Dr.Maixner and Ing.Pažout obtained certificates for newly created cards.
HighScorePlus 4 licencing – evaluation software from firm PANalytical
Laboratory of X-ray diffractometry and spectrometry uses the program HighScore Plus 4 to evaluate powder data. HighScore Plus 4 has got many applications, makes work with database PDF4+ easy and you can read all necessary crystallographic information for Rietveld method with just one click. Single licence costs 10.000Kč and it is not time limited. In the case of interest call Dr.Maixner.
[urlnadstranka] =>
[poduzel] => stdClass Object
(
[43559] => stdClass Object
(
[nazev] => Information
[barva_pozadi] => cervena
[uslideru] => false
[text] =>
Analysis and services
Contacts+staff
Instruments
XRF reports
XRD reports
XRF and XRD data collection
Sample specifications
XRD sample holders
Teaching
Research+Grant projects
Data deposition
How to cite
Quality Marks of PDF cards
Licence-PDF-4+, HighScore Plus 4
Data Viewer
[iduzel] => 43559
[canonical_url] =>
[skupina_www] => Array
(
)
[url] =>
[sablona] => stdClass Object
(
[class] => infobox
[html] =>
[css] =>
[js] =>
[autonomni] => 0
)
)
)
[iduzel] => 43506
[canonical_url] =>
[skupina_www] => Array
(
)
[url] => /rtg-en/license
[sablona] => stdClass Object
(
[class] => stranka
[html] =>
[css] =>
[js] =>
[autonomni] => 1
)
)
[49641] => stdClass Object
(
[nazev] => X´Pert High Score
[seo_title] => Data Viewer
[seo_desc] =>
[autor] =>
[autor_email] =>
[obsah] =>
[urlnadstranka] =>
[obrazek] =>
[poduzel] => stdClass Object
(
[49767] => stdClass Object
(
[nazev] => Information
[barva_pozadi] => cervena
[uslideru] => false
[text] =>
Analysis and services
Contacts+staff
Instruments
XRF reports
XRD reports
XRF and XRD data collection
Sample specifications
XRD sample holders
Teaching
Research+Grant projects
Data deposition
How to cite
Quality Marks of PDF cards
Licence-PDF-4+, HighScore Plus 4
Data Viewer
[iduzel] => 49767
[canonical_url] =>
[skupina_www] => Array
(
)
[url] =>
[sablona] => stdClass Object
(
[class] => infobox
[html] =>
[css] =>
[js] =>
[autonomni] => 0
)
)
)
[iduzel] => 49641
[canonical_url] =>
[skupina_www] => Array
(
)
[url] => /rtg-en/viewer_en
[sablona] => stdClass Object
(
[class] => stranka
[html] =>
[css] =>
[js] =>
[autonomni] => 1
)
)
)
[sablona] => stdClass Object
(
[class] => stranka_submenu
[html] =>
[css] =>
[js] =>
[autonomni] => 1
)
[api_suffix] =>
)