
Mass spectra interpretation
Mass spectrum
Mass spectrum is a plot representing the distribution of detected ions. On the x axis there are the masses of ions (exactly the masses diveded by their charge). The y axis shows the ions intensity. This abundance is expressed either in an absolute form (the ion current from the detector) or in a relative form. In this case, the most intense abundance is set to 100 % and the other intensities are normalized to this value.
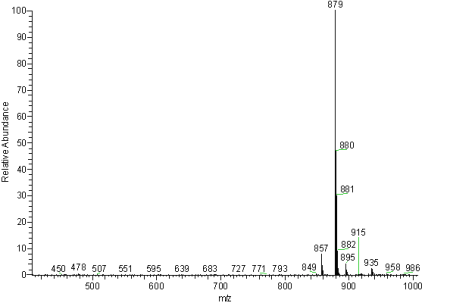
Example of mass spectrum
The mass spectrum of analyzed sample is always affected by the used ionization technique and the other acquisition conditions (polarity mode and resolution). Note that the monoisotopic masses (masses of the all element`s stable isotopes) are shown in the mass spectrum.
Mass accuracy
Mass accuracy by high resolution experiments is verified by instruments calibration. The relative error (in ppm - parts per million) is usually used to express the difference between the meassured and the theretical masses of ions. This relative error is calculated as the follows:
relative error (ppm) = (m/z meassured - m/z theoretical) / m/z theoretical * 1 000 000
m/z theoretical is the substance monoisotopic mass.
High mass accuracy (bellow 3 ppm) helps together with isotope abudances distribution comparison, ion type (even or odd electron) to determine elemental composition of the analysed substance (ion).
Mass spectra interpretation
Electron ionization - EI+ 70 eV
The mass spectra databases help to interpret acquired mass spectrum. The NIST-14 mass spectra database is used. If the reasonable match is not found, the interpretation of the unknown is done by laboratory staff. In this case, the high resolution experiments either EI+ 70 eV or soft ionization techniques (ESI, APCI) may help by interpretation.
Useful links for the EI+ 70 eV spectra interpretation:
UV, IR and MS spectra NIST internet database
The EI+ 70 eV spectra interpretation e-books:
(full access only for the UCT Prague network users)
Smith, R. Martin "Understanding mass spectra : a basic approach"
McLafferty, Fred W., Rengachari Venkataraghavan "Mass spectral correlations, 2nd edition"
Atmospheric ionization techniques - ESI, APCI
The interpretation is usually focussed on the determionation of molecular or pseudomolecular ion. By high-resolution experiments (mass accuracy better than 3 ppm), the determination of substance elemental composition from its molecular ion is possible.
Mass spectrum interpretation results examples
- molecular (pseudomolecular) ion and its charge in mass spectrum and relative error (measured mass compared to substance theoretical mass) - molecular weight confirmation
- confirmation or suggestion of ions elemental composition, determination of rings and double bonds (RDB) values and isotopic models comparison
- more detailed structure characterization - MS/MS high-resolution experiments
Useful links for the interpreation of ESI MS spectra:
(full access only for the UCT Prague network users)
Holčapek M. et al. / J. Chromatogr. A 1217 (2010) 3908–3921: Basic rules for the interpretation of atmospheric pressure ionization mass spectra of small molecules
Bernd O. Keller et al./ analytica chimica acta 627 (2008) 71–81: Interferences and contaminants encountered in modern mass spectrometry